On 4th March 2025, BLK made headlines worldwide when Nasdaq featured the brand on its iconic tower in Times Square, New York City. This monumental moment came hot on the heels of BLK’s impressive £50 million funding round—a major milestone that underscores the company’s rapid growth and appeal to global investors.
Bolstered by its recent success, BLK is now gearing up for a highly anticipated IPO later in 2025. This strategic move represents a natural progression for the company, which has seen a surge in demand for its peer-to-peer marketplace and demonstrates the industry’s heightened confidence in BLK’s potential for long-term market leadership.
The bustling energy of Times Square provided the perfect backdrop for Nasdaq’s recognition of BLK, highlighting the brand’s unwavering commitment to excellence and democratisation of trade. Displayed high above the crowds, BLK’s towering presence captured the attention of onlookers and celebrated a new era of potential and momentum.
The £50 million investment has paved the way for BLK to expand its global footprint, develop cutting-edge products, and strengthen its market leadership. As more investors set their sights on emerging industry leaders, BLK’s feature on the Nasdaq tower symbolizes the growing belief in the brand’s long-term impact.
By showcasing BLK on one of the world’s most recognizable digital billboards, Nasdaq not only acknowledged the company’s impressive achievements but also spotlighted its promising future. This triumphant moment in Times Square is a testament to BLK’s vision, determination, and the growing confidence of stakeholders in the brand’s forward-thinking strategies.
Thank you Nasdaq for this unplanned and yet very welcome feature!
Glasgow, UK – February 27, 2025 – BLK, the UK’s leading online platform revolutionizing the commodities and raw materials trading market, today announced a £50 million equity round from Nimbus Capital, a Panama based investment group, operating globally with a focus on emerging companies and industries with strong growth potential.
This investment significantly boosts BLK’s growth plans and paves the way for a highly anticipated Initial Public Offering (IPO) in 2025, presenting a compelling investment opportunity.
BLK is rapidly disrupting the traditionally offline and inefficient commodities market, offering a seamless and transparent digital platform that connects buyers and sellers of a wide range of raw materials, without intermediaries. This horizontal commodity marketplace model, alongside its direct physical fulfilment arm, addresses a multi-trillion dollar market opportunity ripe for disruption, offering significant potential for growth and investor returns.
“We are delighted to welcome Nimbus as a strategic partner. The shared vision in the disruptive role of our technology, supported by the triple-digit growth BLK underwent over the past year, paves the way for a significant expansion of our operations” said Lalu John, BLK Chief Exec.
“This investment from Nimbus Capital validates our vision and strengthens our position for rapid scaling and ultimately, a successful public listing. Digitalization of the raw material and upstream supply chain is about to transform the market in the same way that it did retail 20 years ago – presenting an unparalleled opportunity.” – commented Gabriele Dadò, BLK’s founder.
Nimbus Capital, known for its strategic investments in high-growth, disruptive companies, recognizes the immense potential of BLK’s platform and its ability to capture a significant share of the commodities market. “Nimbus Capital is proud to back BLK as they transform the $20 trillion global commodities market through digital innovation. Following rigorous due diligence, our investment reflects confidence in their leadership, market strategy, and rapid growth. With AI and blockchain integration, global expansion, and strategic maritime asset positioning in a $14 trillion trade ecosystem, BLK is poised for significant scale. Panama’s trade advantages further amplify their reach, positioning them for a successful IPO and strong investor returns,” said Robert Baker, Managing Partner at Nimbus Capital.
The £50 million investment will be strategically deployed to accelerate BLK’s growth trajectory, including:
Technology Enhancement: Further development of the platform’s capabilities, including the introduction of AI and blockchain to secure transactions and commodities’ chain of custody; enhancing user experience, security and attracting more users.
Market Expansion: Scaling operations globally to capture a larger share of the international commodities market as well as shipping operations to support the increasing trading volume on the marketplace blkcommodities.com.
Asset Acquisition: Exploiting the current low in the maritime market to acquire vessels at low cost, to support the increased shipping demand whilst improving profitability further.
This funding round, coupled with the planned 2025 public listing, offers investors a rare opportunity to participate in the growth of a company poised to become a global leader in the digitalization of commodity trading. BLK’s management team has a proven track record of success and is committed to delivering exceptional value to its shareholders.
About BLK:
BLK is the world’s largest dedicated commodity and raw materials marketplace. Its peer-to-peer approach allows businesses to buy directly from producers, removing the multiple layers of middle-men to bring down procurement costs and enhance profit margins for both suppliers and buyers.
The company is experiencing a strong growth trajectory, with over $6 billion of stock for sale on the marketplace and a revenue growth of 101% YoY.
About Nimbus Capital:
Nimbus Capital is a private investment group specializing in cross-border transactions, providing flexible funding solutions to growing businesses worldwide. Led by experienced managers with a track record of over 50 transactions across 30+ countries and backed by In On Capital, a boutique wealth management firm with USD $1.2 billion in AUM, Nimbus combines industry expertise with a global outlook to drive impactful investments.
The global commodity trading market, a multi-trillion-dollar industry, remains one of the last major sectors operating predominantly offline. Manual processes, opaque pricing structures, and limited market access create inefficiencies that cost traders time and money. However, a wave of digital transformation in commodity trading is on the horizon, promising to revolutionize how commodities and raw materials are bought and sold.
The Untapped Potential of Digitalization
Digital commodity trading opens doors to enhanced transparency, streamlined operations, and broader market access. By shifting away from outdated systems, traders can:
Leverage real-time market data
Automate transactions
Reduce operational risks
Standardize contractual terms
Standardise & due diligence on all players
This evolution benefits not only large corporations but also empowers small and medium-sized enterprises (SMEs) to participate more competitively in global trade.
BLK: The Amazon of Commodities
Leading this digital revolution in commodity trading is BLK Commodities, often dubbed the “Amazon of commodities and raw materials.” BLK has built a robust, user-friendly online commodity trading platform that connects buyers and sellers worldwide, offering unparalleled access to a wide range of commodities.
Key features of BLK’s platform:
Real-time pricing and market data
Secure payment gateways
End-to-end logistics support
Proprietary vetting for all users
Standardized contractual terms for raw material purchases
Explosive Growth and Market Expansion
BLK’s impact on the market has been extraordinary. Over the past three years, the company has doubled its revenue each year consecutively, a testament to its disruptive business model and the growing demand for digital solutions in commodity trading.
BLK’s strategic expansion into high-potential markets like India, Japan, and Australia has further fueled growth, tapping into some of the world’s largest and most dynamic commodity markets. These regions offer immense opportunities due to their robust industrial sectors and increasing demand for streamlined trading solutions.
Why Now Is the Time to Go Digital
The timing for digitalising commodity trading couldn’t be better. Global supply chain disruptions, rising commodity prices, and the growing demand for transparency have accelerated the need for online trading platforms.
Key benefits of digitalizing commodity trading:
Efficiency Gains: Automating manual processes like invoicing and purchase order generation reduces time and costs – saving SMEs between 1,000 and 10,000 hours per year on procurement.
Market Transparency: Real-time data ensures fair pricing and better decision-making.
Global Reach: Digital platforms break down geographical barriers, opening access to new markets without the need for businesses to establish a physical office presence.
A Prime Investment Opportunity
For investors, BLK Commodities presents a rare opportunity to be part of a disruptive and rapidly expanding company in the digital commodity trading space. With consistent year-over-year revenue growth and successful global market expansion, BLK is poised for continued success.
Why invest in BLK Commodities?
Proven Growth: Over 100% annual revenue growth for three consecutive years.
Market Leadership: Positioned as the go-to horizontalonline commodity marketplace.
Scalable Model: Strong potential for continued global expansion. Shipping operations supported by a digital, online scalable framework.
Innovative Solutions: Leveraging technology to disrupt traditional commodity trading – transforming a multi-trillion dollar market.
History Repeating Itself: we have seen it happen with retail in the early 2000’s. Now is the time for upstream supply chain to undergo its digital transformation.
Conclusion
The commodity trading market is on the brink of a significant transformation. As more industry players embrace digitalisation, platforms like BLK are leading the charge, unlocking new opportunities and setting new standards for efficiency and transparency.
With its rapid growth and strategic market expansion, BLK is not just digitalising commodity trading—it’s revolutionizing it. For traders and investors, now is the perfect time to leverage this digital wave.
Ready to invest in the future of commodity trading?
Recognition highlights BLK’s commitment to sustainable shipping and market leadership
Glasgow, February 19, 2025 — BLK Shipping has been named Green Shipping Company of the Year 2025 by SME News, a leading UK-based publication that recognises excellence and innovation in business. This prestigious award celebrates BLK’s dedication to providing eco-friendly shipping solutions within the global commodities market.
BLK Shipping, the logistics arm of the BLK CommoditiesGroup, plays a crucial role in fulfilling orders from the company’s rapidly growing marketplace. By leveraging a fleet of efficient, low-emission vessels, BLK has consistently minimized its environmental impact while ensuring timely delivery of millions of tons of raw materials and commodities each year.
“We are proud of this recognition by one of the UK’s leading media outlets,” said Lalu John, CEO of BLK Commodities. “It is a testament to BLK’s strong growth and our ongoing commitment to sustainability, especially as we gear up to ship an additional 1.5 million tons of cargo in 2025. Our green fulfillment services not only benefit our customers but also help reduce the carbon footprint of global shipping.”
The Green Shipping Company of the Year award highlights BLK’s efforts to adopt cleaner technologies, optimise shipping routes, and invest in sustainable logistics practices. As global demand for greener supply chains increases, BLK continues to set industry benchmarks in both efficiency and environmental responsibility.
With its marketplace now hosting over $6.5 billion worth of commodities, BLK is proud to serve a diverse network of buyers and sellers, offering them dedicated and eco-conscious fulfilment solutions that align with modern sustainability goals.
About BLK Commodities: BLK Commodities is a leading marketplace for buying and selling raw materials, spanning sectors like agriculture, metals, energy, and chemicals. With a focus on efficient logistics and green shipping, BLK connects global suppliers and buyers through a streamlined, sustainable platform.
Welcome to BLK Shipping, our regular update from the shipping market. In this issue, we’ll be covering:
Wet Cargo
Dry Cargo
Containers
Gas
Subscribe to our newsletter to stay up-to-date with our Shipping Weekly and follow us on Facebook and LinkedIn to never miss an update.
Wet Cargo
The increasing price of crude oil has been driving the tankers’ charter rates up, although the availability of VLCCs meant a general slowdown for this segment.
VLCC – Very Large Crude Carriers saw a decline over the past week, primarily due to the oversupply of tonnage in the market. Outlook: Stable
Suezmax – strong rally Sith over 1800% increase WoW for suezmaxes, with a very strong performance, especially in the Mediterranean. Outlook: Positive
Aframax – afra rates more gained ground, with a general strengthening across most routes. Outlook: Positive
Dirty Products – Apart from the usual busy market in the Med and Black Sea, demand remained weak in all other regions, causing rates to soften. Outlook: Stable.
Clean Products – Charter rates weakened across the board with some routes losing over 50% WoW. The MR market remained relatively oversupplied, and the lack of available cargoes did the rest to cause charter rates to slip by an average of 10% Outlook: Negative
MR – weakening demand did not support the MR rates, which, coupled with the oversupply of carrying capacity in the market, caused rates to fall across the board. Outlook: Negative
LR1 –demand for log-range tankers fell in the last few weeks and continues on a downward trend. Outlook: Negative
LR2 –LR2 tankers weakened approx. 20% WoW but, on average, remain still strong compared to this summer. Outlook: Stable
Handy –Handy earnings weakened too, returning below $3500/day and losing all the ground gained in September Outlook: Stable
Dirty Panamax – Rates softened on most routes, bringing Panamax rates down 22% compared to last month. Outlook: Negative
Dry Cargo
Strong performance for the bulkers on most routes and across all segments, with rates at their highest levels in over 10 years.
Capesize – Capes grew up to 30% in the last week, averaging nearly $73k/day and rates climbing sharply to unchartered heights. Outlook: Positive
Panamax – Still another good week for the panamaxes, although slightly in decline on the Atlantic and on the routes Indonesia to China. Outlook: Positive
Supramax – Supramaxes lost ground in recent days, after climbing steadily over the course of 2021. The second half of September saw relatively steady rates, settling on an average of $30k/day Outlook: Stable
Handysize – Handy market still performing very well. After a strong July-August rally, a slow-down in September now it settled on $36k+/day with short voyages routes fetching over $40k/day. Outlook: Stable
Container
Container rates finally found some market resistance, with Neo-panamaxes vessels finding difficult to push much above the $145k/day mark.
Backlogs in major ports are gravely disrupting supply chains, with queues of over 70 container vessels at Long Beach and other major ports in the US, Europe and China.
We are now seeing, as predicted, a decrease in smaller-batches shipments westbound from Asia to Europe, accompanied by a subsequent easing of the TEU rates which now came down on the high $8000s mark.
Outlook: Stable
Gas
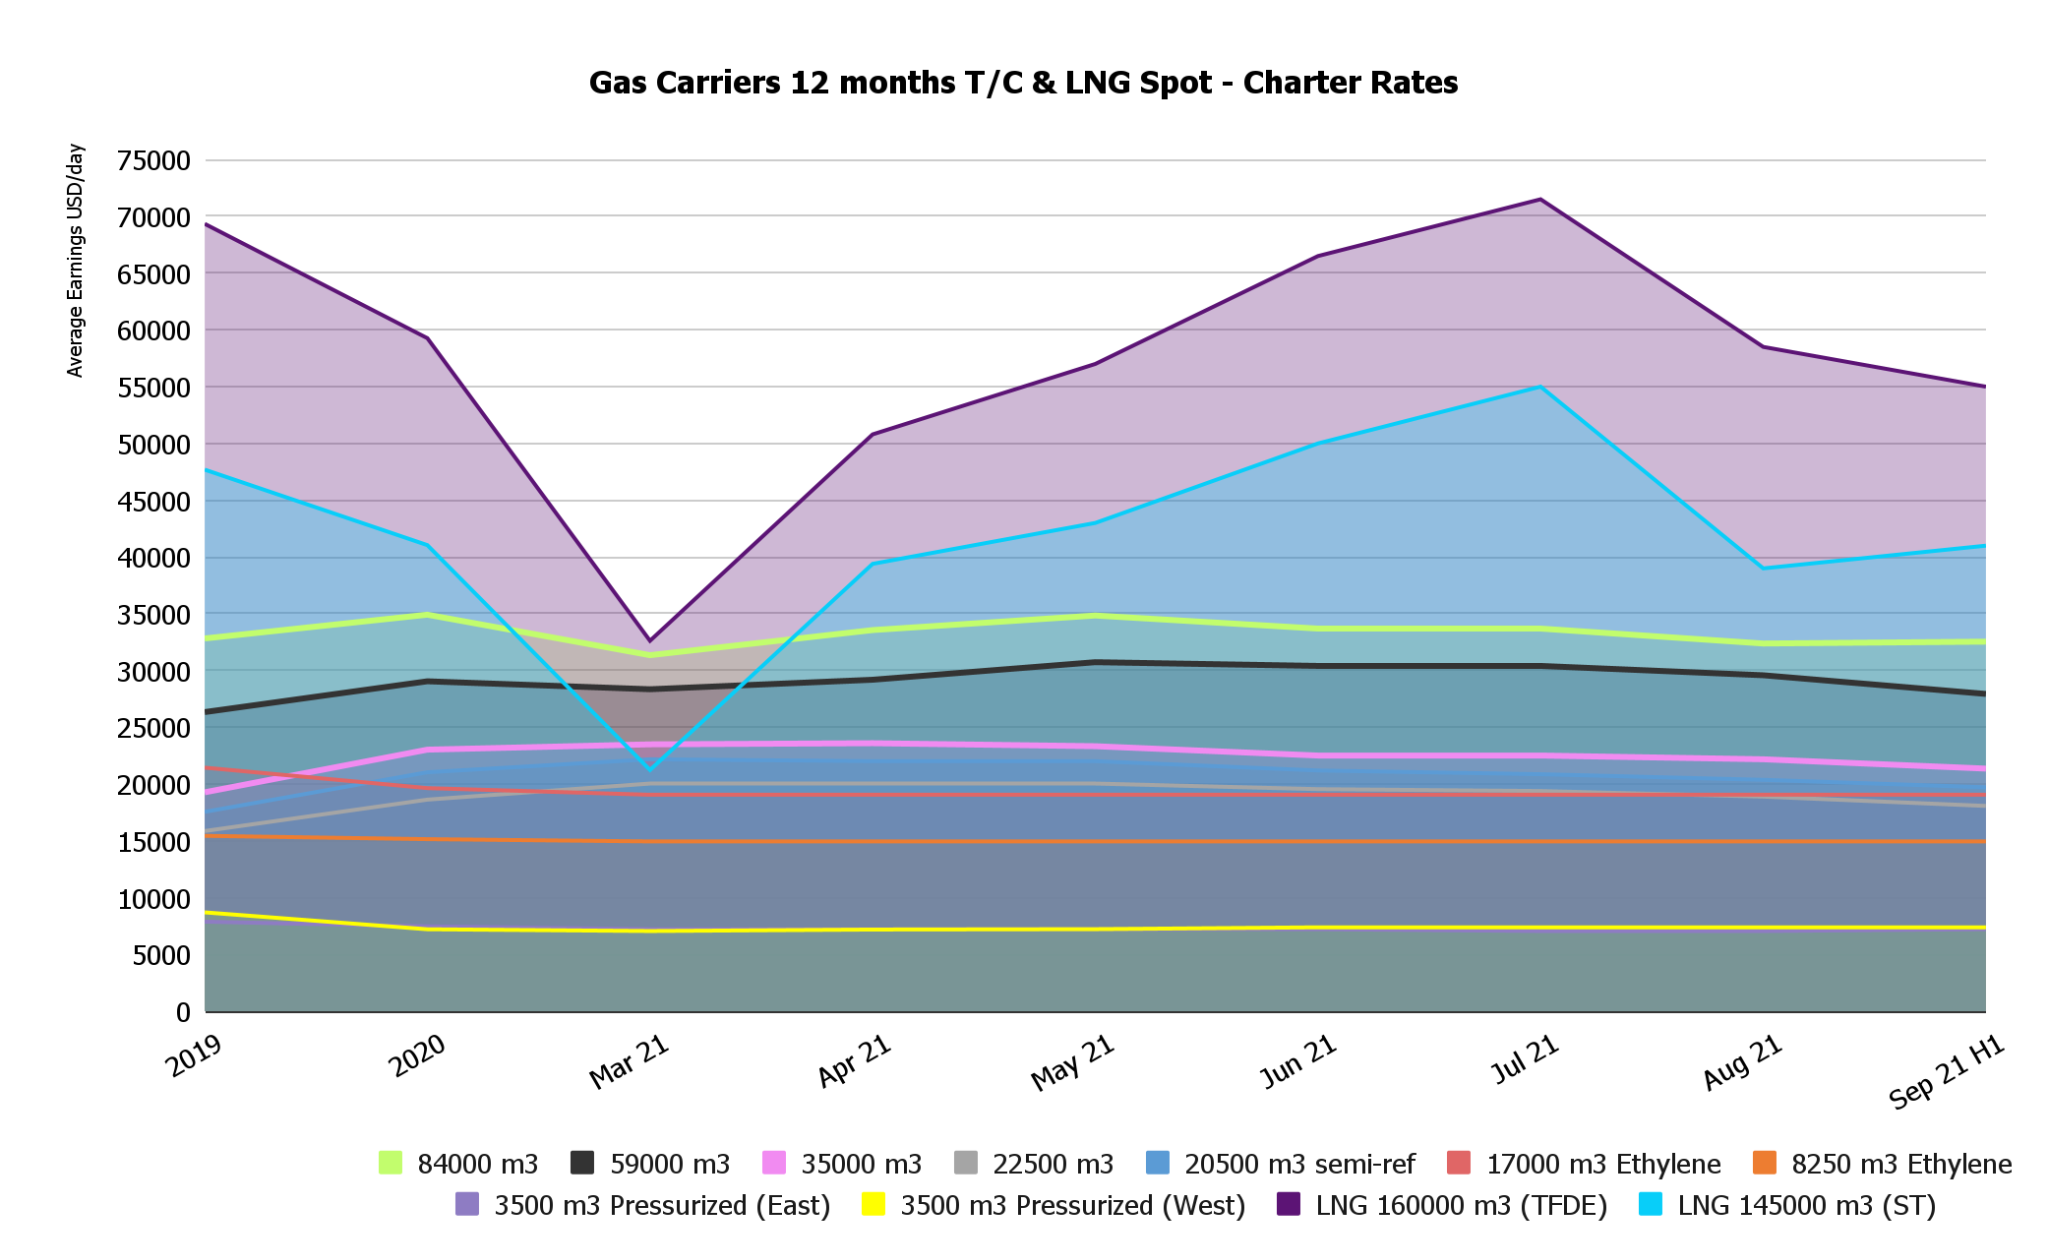
Rates for Gas Carriers rallied, driven by the strong demand for gas worldwide and the surge in prices across Europe and North America.
Pressurized and semi-pressurized vessel rates remained constant, whilst the biggest winners appeared to be LNG carriers, with rates now nearing the $85k/day for 160000 m3 vessels.
Outlook: Positive
To learn more about how we can support your business shipping as cheaply and environmentally-friendly as possible, visit us at BLK.
Subscribe to our newsletter to stay up-to-date with our weekly shipping updates.
Did you miss our previous shipping article? Read it now.
Welcome to BLK Shipping, our regular update from the shipping market. In this issue, we’ll be covering:
Wet Cargo
Dry Cargo
Containers
Gas
Subscribe to our newsletter to stay up-to-date with our Shipping Weekly and follow us on Facebook and LinkedIn to never miss an update.
Wet Cargo
Oversupply of carrying capacity in the market counterbalanced significantly the rising price of oil and the tanker rates kept dropping across the board, with the only exception of VLCCs
Crude Tanker Spot Charter Rates
VLCC – Very Large Crude Carriers were the only vessels with a strong performance, given their direct link to the crude trading. China routes were the busiest with a 3.5 times increase WoW. Outlook: Positive
Suezmax – rates weakened on all routes with the only exception of the Indian Ocean, where Suezmaxes did 9% better than the previous week. Outlook: Stable
Aframax – the Med remained the only area where Aframaxes keep performing, with a general, continued declined that went on throughout September. Outlook: Stable
Crude Tankers Spot Charter Rates
Dirty Products – Relatively busy in the Mediterranean, whilst demand remaining weak in all other regions, with a marked oversupply of carrying capacity. Outlook: Negative.
Clean Products – Charter rates weakened across the board, especially for short voyages. Outlook: Stable
Product Tanker Spot Cargo Rates
MR – uptake in demand did not have the expected positive effects on MR rates, owing to the oversupply of carrying capacity in the market. Outlook: Negative
LR1 –demand for log-range tankers fell in the last few weeks. Outlook: Negative
LR2 –continued decline in LR rates would appear to continue on this trend as plenty of vessels remain unemployed. Outlook: Negative
Handy –Handy earnings bounced back below $4000/day with a weakened performance on all routes except the Med. Outlook: Stable
Dirty Panamax – Rates continued softening pretty much all routes, with a recorded drops up to 30% WoW. Outlook: Stable
Product Tanker Spot Rates
Dry Cargo
Bulk carrier rates rallied during the past week with a market “on fire”and at its highest since 2008. WoW growth recorded up to 44%, pushing capesize rates beyond $60k/day on some routes.
Bulk Carrier Spot Cargo Earnings per day
Capesize – Capes were the strongest performers in a very active market, characterised by a strong demand and an undersupply of carrying capacity Outlook: Positive
Panamax – Still another good week for the panamaxes, with an average growth of 5% across the board and a decisively positive outlook. Outlook: Positive
Supramax – Supramaxes remained relatively stable, with recorded variations up to 3% and average rates just north of $31,500/day Outlook: Stable
Handysize – small-sized bulkers did relatively well in the past couple of weeks, with a continual growth now averaging $34k+/day and voyage charters smashing through $40k/day on South-American routes. Outlook: Positive
Bulk Carrier Spot Charter Rates
Container
Container rates finally look like they’re stabilising, with Neo-panamax vessels settling just above the$145k/day mark and container prices on the routes China-Europe recording an inflexion for the first time in months.
Container Vessel Average Earnings per TEU per day
On the raw materials side, however, and especially in chemical commodities, the high freight rates keep impacting prices of goods to the extent that it is equivalent or cheaper to source from European suppliers.
This has led to a decrease in smaller-batch shipments westbound from Asia to Europe which, together with the ongoing raw material shortage and increase in prices of Chinese factory outputs, provoked a subsequent easing of the TEU rates. We should continue seeing this trend toward the end of the year and possibly into 2022.
Outlook: Stable
Container Vessel Charter Rates
Gas
Rates for Gas Carriers declined slightly, with a 18% hit suffered by for 145,000 m3 LNG Carriers.
Gas Tankers Cargo Rates
This was expected as plenty of tonnage was tied-up in dock for ballast water treatment systems installation and is now slowly coming back into the market, increasing overall supply. Outlook: Stable
To learn more about how we can support your business shipping as cheaply and environmentally-friendly as possible, visit us at BLK.
Did you miss our previous edition of BLK Shipping? Check it out!
Subscribe to our newsletter to stay up-to-date with our weekly shipping updates.
BLK was born as the digital marketplace dedicated to commodities and raw materials.
It was born from the awareness that the digitalization of commodity trading is not a question of if, but of when.
It was born to allow anyone, regardless of the size of their company, to buy directly from producers, wherever they are, paying the real value of the goods, thanks to a transparent and digital market.
Our mission is to allow anyone to purchase the raw materials they need for their business, with a simple click. It is inevitable, we saw it happen in the late 1990s with the disruption of retail at the hands of those who are now e-commerce giants.
It will happen again, for B2B purchases. It is already happening. BLK is its driving force.
Buy raw materials for your business from the comfort of your home
The platform that allows anyone to buy securely, in a few simple clicks. It allows you to find local and global suppliers, compare prices, specifications, delivery terms. And to buy as today we are all used to doing, online, from the comfort of home.
Thanks to the automatic invoicing and order generation as well as integrated accounting, today BLK saves 1000s man hours per year in administration tasks.
Micro and small businesses, the target market of our marketplace, have halved their procurement costs (on average a reduction from 40% to 60%).
Blkcommodities.com is the home of over $1B worth of trade, and active across 7 main categories.
Agricultural
Chemicals
Energy
Construction
Main Bulks
Industrial
Metals
Our Marketplace division has been growing on a quarterly rate of 270%+ and, to date, suppliers on our marketplace trade $332M-worth of chemical commodities; $242M of metal products (including grade A steel, stainless steel and high-strength alloys); $238M of Agriculturalgoods and $219M of energy products. Find out more about our marketplace’s key indicators here.
Outsource your supply chain. Reduce fixed costs. Cut variable costs.
At BLK we put at your disposal our expertise in supply chain management, international negotiations and project management to make our partners’ operations leaner, more effective and more profitable.
We pool the volume of multiple businesses with that of buyers across the UK and Italy, using the aggregated purchasing power to negotiate better deals with suppliers globally.
We scout, vet and negotiate directly with manufacturers on behalf of our partners, organizing logistics and providing a complete supply chain management solution to keep fixed costs as lean as possible, whilst reducingvariable costs.
In this case, we address corporate and medium-sized enterprises, helping them to streamline their procurement processes, automate order generation, invoicing and reporting, with the aim of increasing their competitiveness on foreign markets.
Reduce the environmental impact of your supply chain and earn with carbon credits.
We help our partners reduce their environmental impact by purchasing from local suppliers or by aggregating volume with that of other companies. In addition, we organize logistics in the most environmentally friendly way possible, reducing the overall emissions of our customers’ supply chain.
Companies that rely on us can also earnfrom this emissioncut: their lower environmental impact is rewarded with Carbon Credits, which can be exchanged on the European Environmental Exchange.
With BLK, going green means generating a whole new revenue stream!
Quality – Cost – Service Delivery are the foundations of our criteria
BLK developed a proprietary (patent pending) rating system to assess the key metrics of our customers and suppliers.
Quality – Cost – Service Delivery are the foundations of our criteria.
We help companies understand their positioning in the market based on these three areas and support them in improving their positioning through a detailed guide that translates into operational and actionable advice.
In addition, our rating provides further confirmation of the standing of suppliers, allowing those who buy to base their decisions on relevant parameters and on the awareness of having available commercial partners previously evaluated with a thorough level of scrutiny which goes beyond the mere financial report.
Investor Relations
Headquartered in Glasgow, BLK has been selected as one of the UK’s top 30 tech start-ups.
After a seed round concluded in January 2021, we are supported by Italy’s #1 accelerator and one of Europe’s top venture builders: Enry’s Island. We have a 10-strong team distributed between the UK, Italy and the United Arab Emirates.
Team
Led by founders from shipping, commodity trading, project management and banking, the BLK team is structured in four units: Product, Market, Fundraising and Corporate, each in charge of specific tasks and well positioned to support BLK’s rapid growth.
Product: designers and developers
Market: one-to-one sales, one-to-many sales and digital PR
Fundraising: investor relations
Corporate: HR, legal, supply chain
Discover More
To learn more about how we could build a strategic partnership, both industrial and fundraising, contact:
Gabriele Dadò – Founder & CEO gabriele.dado@blk-global.com +44 7757630638
QUALITY – COST – SERVICE DELIVERY ARE THE FOUNDATIONS OF OUR RATING CRITERIA.
Here’s how we specifically assess “Service Delivery”.
A background check must go beyond the mere credit report, which is readily available for the vast majority of the business anyway and does not give a true reflection on the actual operational profile of a company.
Standard credit reports fall very short of evaluating a business’ quality, its positioning in relation to cost and, most importantly, service delivery.
For this reason, BLK has developed a proprietary evaluation method, currently used as a reference standard within the commodity trading and chemical manufacturing industries and validated on hundreds of clients already.
The BLK Rating, which covers in detail not only financials but Quality, Cost and Service Delivery, with a deep scrutiny on companies’ environmental footprint as well, paints a comprehensive picture of a business’ real position and capabilities.
In this article, we’ll look specifically at how BLK assesses Service Delivery to build the overall company rating.
Service Delivery is a mix of multiple factors. It’s not merely “how well did a supplier do on this specific order”. It’s about a business’ overall approach to continual improvement and it translates into how to operationally fulfil orders as swiftly, efficiently and effectively as possible.
1. Number of Warehouses / Plants
The number of plants and warehouses gives an indication on the scale of a business operations and on its capacity to promptly serve customers in a specific geographic area.
A high number of plants means high output capacity and high number of warehouses is likely to signify prompt stock availability and quick order dispatch upon reception of orders.
2. Average Lead Time
Yet, scale alone is not a good indicator of “how well a company performs” or “how well does it fulfil its contractual obligations”. On the contrary, scale can oftentimes be detrimental, with more level of approvals, more bureaucracy and less flexible organisational structure that slows down the whole process.
Most large corporates suffer from this disease and it is therefore critical to assess a company’s actual lead time from order reception to dispatch in order to have clear visibility of its fulfilment efficiency.
BLK looks at the track record of company lead times, from order reception to delivery EXW in order to properly quantify “how well” it performs and how quickly it can get orders ready for customers.
3. Production Capacity
Usually in direct correlation with the company size and number of warehouses, the production capacity is a good indicator of the ability to quickly fulfil an order.
High production capacity means likely high levels of stock which, in turn, impacts positively on the lead time and translates into ready availability of the goods.
4. Own Delivery Network
The direct ownership of a fleet of vessels, them being ships, trucks, vans or aeroplanes, generally means direct control over their logistic operations and streamlined decision making. It means ready availability of the vessel, direct control and quicker fulfilment.
Although not applicable for small quantities, where companies often times rely on third-party freight forwarders, the above is true specifically for large volumes.
Having a vessel under direct ownership or bareboat charter means no lag time spent waiting on the owner’s availability, negotiating charter rates, appointing agents etc.
Not only that; direct ownership of a delivery network also means cheaper transport costs and better value for the end customer.
5. After-sales / Customer Service Department
Having a dedicated after sales team and a full time, in-house customer service department directly translates into a more inclusive client journey, better customer care and overall improved experience.
It is massively important to have someone human at the other end of the phone to pick-up enquiries, deliver updates on a shipment and, in general, develop those one to one connections that are essential in the development of any business relationship.
6. Reviews: Customer Service
After every order, buyers on BLK can review n0t only the product, but the seller. In particular, they are asked to assign a star value (from 1 to 5) for various different performance areas, one of these being “Customer Service”.
The overall BLK Rating Score for a supplier is computed, among other things, on the basis of that supplier’s score in relation to Customer Service.
7. Reviews: Communication
Just like Customer Service, buyers can review specifically the “Communication” bit when leaving feedback to a seller.
This mark gets factored into the overall rating and used to paint a comprehensive picture of a company’s Service Delivery performance.
Do you want to get a freeassessment of your company to understand how you position in respect to Quality, Cost, Service Delivery and how you stack-up against your direct competitors?
Welcome to BLK Shipping, our regular update from the shipping market. In this issue, we’ll be covering:
Wet Cargo
Dry Cargo
Containers
Gas
Subscribe to our newsletter to stay up-to-date with our Shipping Weekly and follow us on Facebook and LinkedIn to never miss an update.
Wet Cargo
The increasing price of crude oil has been driving the tankers’ charter rates up throughout July, although this has now slowed down and we are seeing a further downward trend in rates.
VLCC – Very Large Crude Carriers remained pretty much stable. Although we’re still unbelievably far from 2019 levels, we can now see positive signs of pick-up. Outlook: Stable
Suezmax – rates remained still, apart for a few routes where we saw a near 100% growth. As the oil price stabilises, we expect that the vessel charter rates will go with it. Outlook: Stable
Aframax – afra rates more lost ground, with a general weakening across most routes. Outlook: Stable
Dirty Products – Relatively busy in the Mediterranean, whilst supply and demand remaining weak in all other regions. Outlook: Stable.
Clean Products – Charter rates weakened across the board with some routes losing over 70% WoW.. Outlook: Stable
MR – uptake in demand did not have the expected positive effects on MR rates, owing to the oversupply of carrying capacity in the market. Outlook: Stable
LR1 –demand for log-range tankers fell in the last few weeks. Outlook: Stable
LR2 –Good rally for LR2 tankers, up to 20% surge in a week. Outlook: Positive
Handy –Handy earnings bounced back up above $7000/day and it looks like the beginning of a positive performance. Outlook: Stable
Dirty Panamax – Rates continued softening very slightly on all routes, with a general 1% – 5% drop since last week. Outlook: Stable
Dry Cargo
Slow-down on most routes and across all segments, although bulkers remain pretty strong compared to 2019 and 2020 performance.
Capesize – Capes declined between 5 to 20%, having broken through the $40k/day for the first time in years and now travelling on $41k+/day for scrubber-fitted vessels. Outlook: Stable
Panamax – Still another good week for the panamaxes, although slightly in decline compared to the last week of August. Outlook: Stable
Supramax – Supramaxes lost ground in recent days, after climbing steadily over the course of 2021. The second half of August and early September saw a reduction of 4-7% to settle on an average of $35k/day Outlook: Stable
Handysize – the biggest fluctuations happened within the Handy market. Still high after a strong July-August rally, now it fell slightly to $32k+/day mark. Outlook: Stable
Container
Container rates seem unstoppable, with 4400 TEU vessels now nearing the $100k/day mark themselves. Neo-panamax vessels are now close to the $145k/day mark, with a significant impact on the economy of most western countries coming out of the pandemic.
On the raw materials side, however, and especially in chemical commodities, the high freight rates (now looking upwards of $20,000 per TEU on the route China – Europe) now impact prices of goods to the extent that it is equivalent or cheaper to source from European suppliers.
We expect to see a continual decrease in smaller-batches shipments westbound from Asia to Europe, hopefully accompanied by a subsequent easing of the TEU rates towards the end of the year.
Outlook: Positive
Gas
Rates for Gas Carriers remained declined slightly, with the biggest hit suffered by for large carriers 145,000 m3 and above. Pressurized and semi-pressurized vessel rates remained constant.
This was expected as plenty of tonnage was tied-up in dock for ballast water treatment systems installation and is now slowly coming back into the market, increasing overall supply. Outlook: Stable
To learn more about how we can support your business shipping as cheaply and environmentally-friendly as possible, visit us at BLK. Subscribe to our newsletter to stay up-to-date with our weekly shipping updates.
Quality – Cost – Service Delivery are the foundations of our Rating Criteria.
Here’s how we specifically assess “Cost”.
A supplier background check must go beyond the mere credit report, which is readily available for the vast majority of the business anyway and does not give a true reflection on the actual operational profile of a company.
Standard credit reports fall very short of evaluating a business’ quality, its positioning in relation to cost and, most importantly, service delivery.
For this reason, BLK has developed a proprietary evaluation method, currently used as a reference standard within the commodity trading and chemical manufacturing industries and validated on hundreds of clients already.
The BLK Rating, which covers in detail not only financials but Quality, Cost and Service Delivery, with a deep scrutiny on companies’ environmental footprint as well, paints a comprehensive picture of a business’ real position and capabilities.
In this article, we’ll look specifically at how BLK assesses Cost to build the overall company rating.
Cost is a mix of multiple factors. It’s not merely “how expensive (or cheap) is the specific product (or quote)”. It’s about a business’ overall approach to pricing and its positioning in respect to that.
1. Average gross margin
The first item we look at when evaluating cost is the company’ average gross margin in the past 3 years. This gives a good indication on whether the company falls within the average for the industry, above or below, and in which quartile.
An average, constant gross margin in the bottom quartile, means that the company is positioned aggressively in respect to pricing and therefore not only the specific product, but their whole range is likely to be competitive in absolute terms.
2. Price vs platform
It is also important to look at the price of the specific commodity compared to those of other suppliers on BLK.
We pride ourselves of being the “Online Spot Market” and as such we drive strong price competition from vetted suppliers all over the world. A company’s price may be competitive for a specific country but fall short when compared to that of overseas competitors.
We take into account the global landscape, giving buyers a feel of how the supplier stacks up internationally.
3. Average price vs index
To complement that, we also compare the specific price of goods to that of the commodity index (whenever applicable).
This way, we get the full picture, not only via the benchmark with the rest of the private market but with the institutional one as well, comparing the BLK supplier rates’ with those achieved by the movers of huge volumes such as investment banks and blue chip trading houses.
4. Credit Terms
It’s not just about “how much does it cost” but also “how much flexibility do I have for my payment”.
Suppliers that offer credit terms and payments in instalments as opposed to pre-payment only, are ranked higher than those who don’t.
BLK acts with a buyer-centric approach and the easier supplier make for a buyer to purchase, the higher it speaks of their credibility and cost positioning.
5. Price for Specific Order
Finally, we look at the specific quote or price and evaluate it with our team of expert category managers who assign a rating on the basis of their expertise in the international landscape, market conditions and supply-demand knowledge at the specific point in time.
6. Fixed vs Variable Cost Ratio
The ratio between fixed and variable costs for the company gives an indication of how heavy the company’s specific cost base is (in relation to their cost of sales). If the Fixed/Variable costs ratio is relatively low, it underpins a strong dependance from raw materials and possibly a conservative approach to margin.
These are indicators that the company tends to be more competitive than average, and the benchmark with the index and platform average prices for the same commodity, give the full assessment on how aggressive on pricing the supplier actually is.
To find out more on how we assess quality, check out our detailed post.
Do you want to get a freeassessment of your company to understand how you position in respect to Quality, Cost, Service Delivery and how you stack-up against your direct competitors?